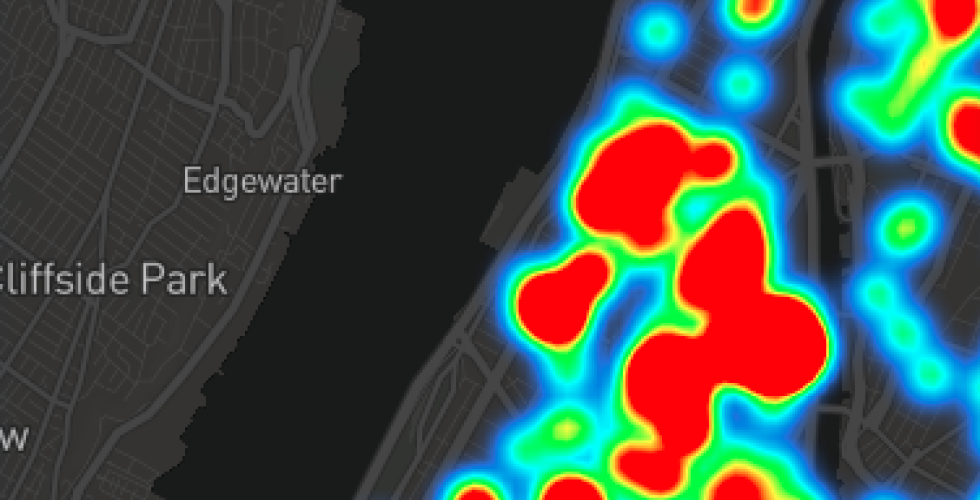
Web Mapping 2: Custom Map Tiles

In the previous tutorial, we created markers using Mapbox GL JS by declaring them explicitly in our code. Our basemap data came from Mapbox's defaults, which in turn come from OpenStreetMap. In this tutorial, we will create a tileset using external data. Just like QGIS, Mapbox can add layers from vector, raster, and point-based information. Unlike QGIS, which works with maps at a single level of detail, Mapbox converts data to tiles which are delivered to the browser as they are needed. The data in each tile is limited to a bounded geographic area and zoom level, the result of which is that certain things can be visualized only at relevant times, rather than everything needing to be visualized all at once. This allows for the kind of interactivity we have come to expect from web maps, and it also allows us to make local calculations about the user's position in relation to data. The theme of this tutorial will be a classic element of NYC life.