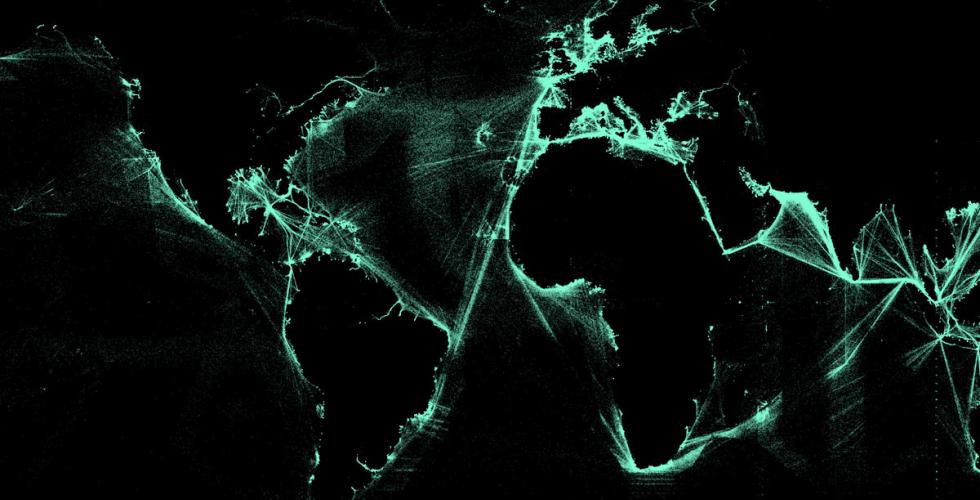
Ninety percent of all goods worldwide are moved by ship, but shipping is mostly invisible. More than 300 million Metric Tons of energy are shipped in and out of the United States each year, in 60,000 shipments. This project presents the ports and paths of the 2.7 billion Metric Tons of energy shipped through more than 90 US ports from 2002 - 2012. Using data assembled by Thomson Reuters, Port to Port maps global oil shipping routes as well as other forms of energy navigating ocean territories to and from the United States. Using D3 as an interactive web platform we designed a map interface that is scaled globally while embedded with local stories about energy movement from port to port. Data can be viewed across time, which reveal changes in patterns of movement as the geopolitics, price of oil, and conditions at specific ports change.