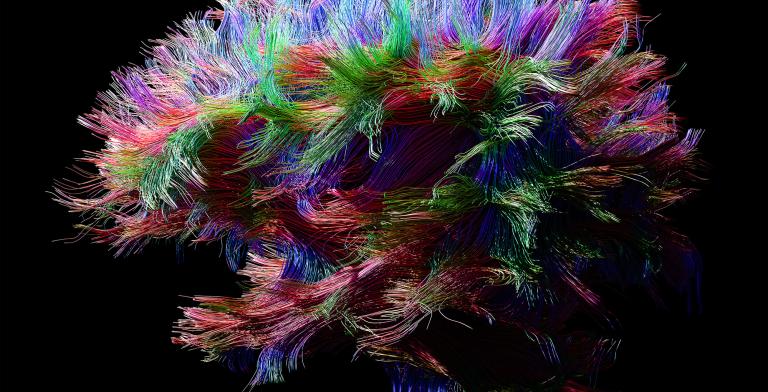
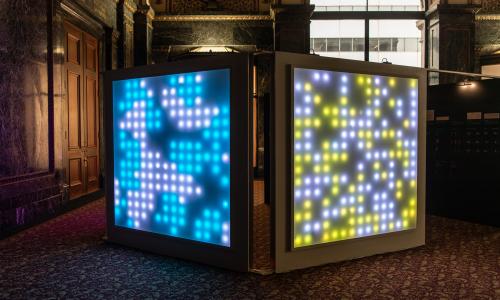
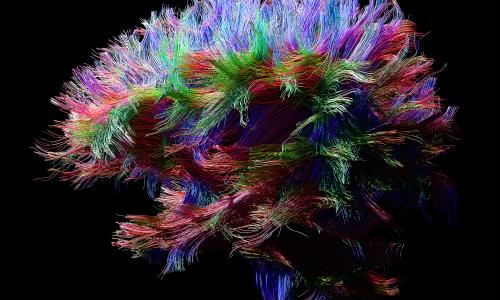
The Curse of Dimensionality investigates how computational intelligence systems define threats, measure risk, and track conflict. By characterizing patterns of violence into categories, accelerating decision-making, and shaping public perception, these models influence not only how conflicts are understood but also how they unfold. In technical terms, the “curse of dimensionality” names a problem of scaling — as the number of features (dimensions) in training data increases, models require exponentially more data to be accurate, and interpretability is often sacrificed. Across three related algorithms, the exhibition explores the effects of AI in conflicts at a variety of scales.
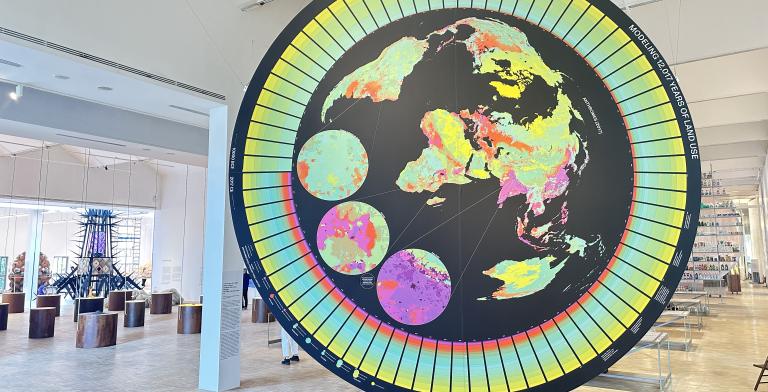
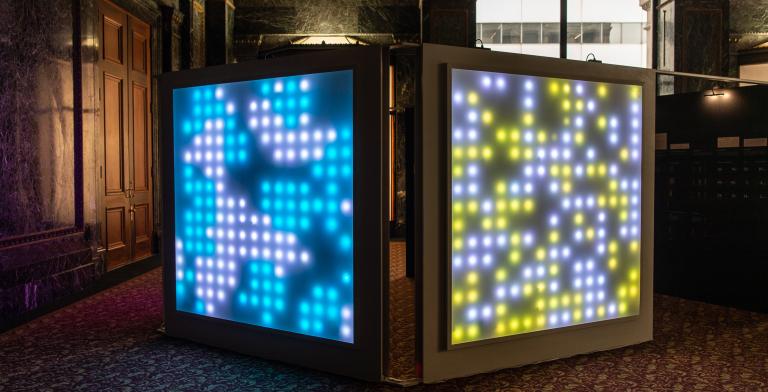
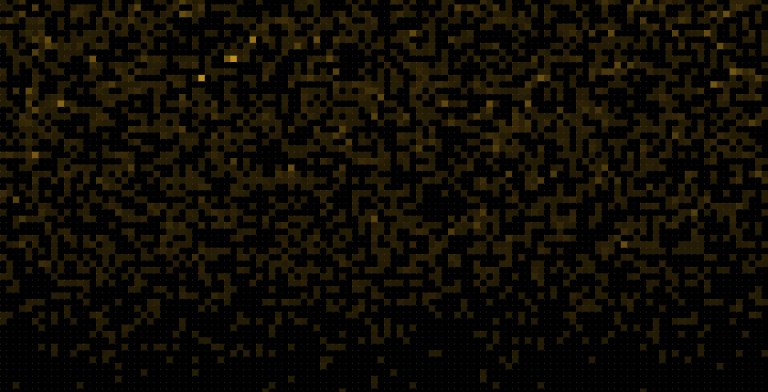
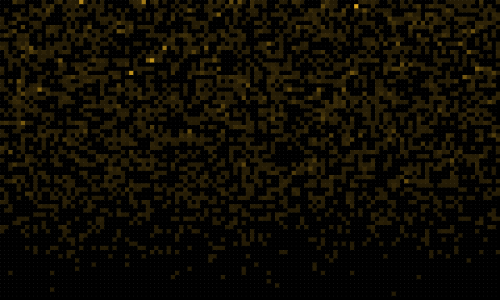
More than 70% of terrestrial nature has been shaped, in very different ways, by people. Anthromes are defined as the ecological patterns shaped by human habitation. Visualized here is the Anthromes Dataset—a “hindcast,” a model built from global population and land use data showing change over 12,017 years. As global population increases and urbanization accelerates, biodiversity shrinks. Preserving both “cultured” and “wild” lands is key to preserving biodiversity.
This installation is part of the exhibition We the Bacteria. Notes Toward Biotic Architecture, curated by Beatriz Colomina and Mark Wigley, and presented at the 24th Triennale Milano International Exhibition, where it received the Bee Award for the Best Original Project.
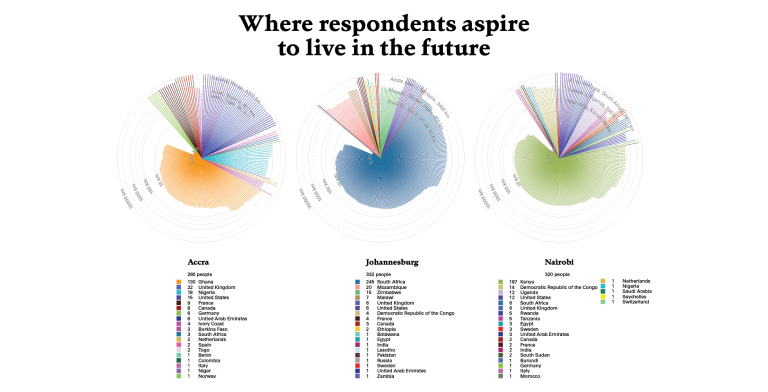
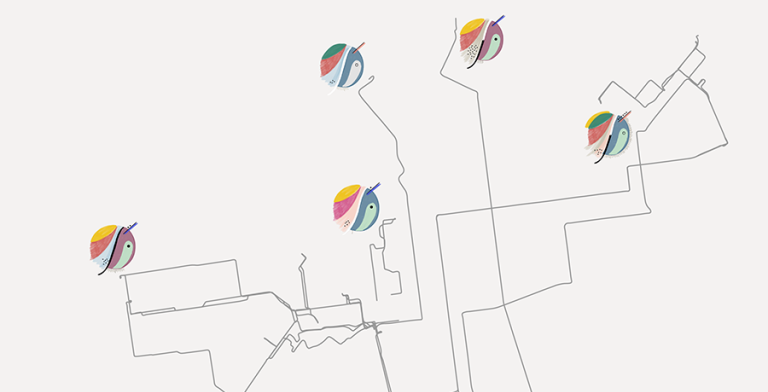
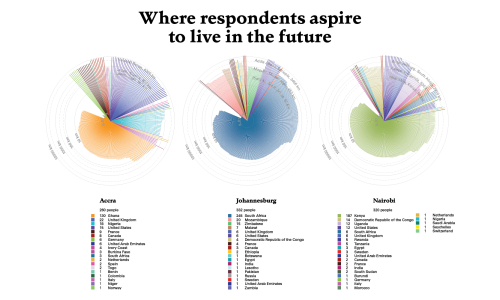
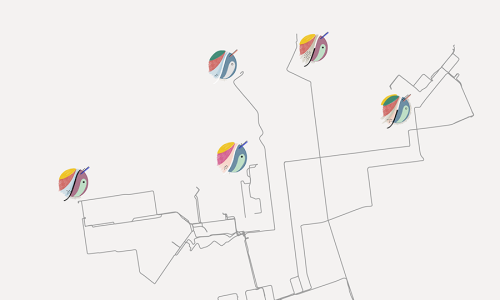
In an era of increased fluidity, political devolution, institutional fragmentation, and economic and environmental precarity, African cities are reshaping under a young population preparing for uncertain futures. This project seeks to understand the emerging patterns of human mobility, urbanism, and socio-political changes through extensive surveys in Accra, Nairobi, and Johannesburg, conducted by the African Centre for Migration and Society (ACMS). It visualizes residents' connections to place and captures the intricacies of their fragmented and uncertain lives. This research, in collaboration with the University of the Witwatersrand, aims to generate data for further academic exploration, policy reconsideration, and to enhance understanding of spatial inequality and future politics in Africa.
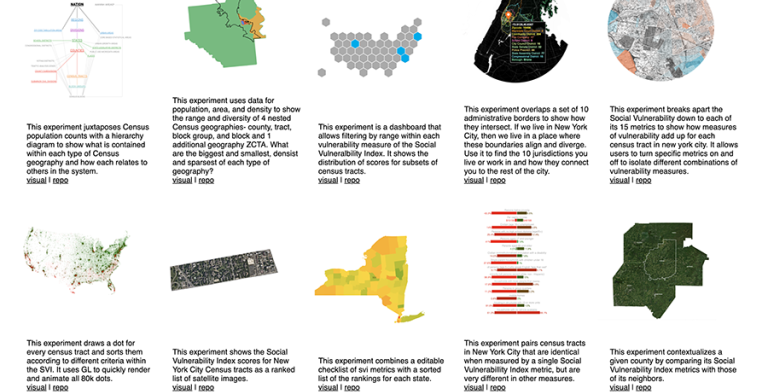
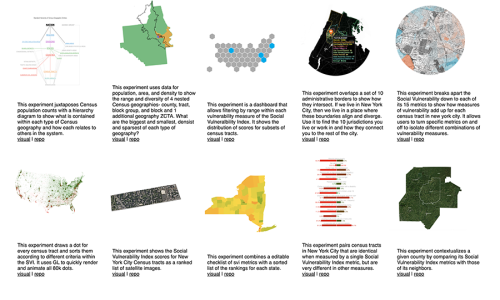
These experiments deal with how Census data is structured, packaged, and how it can be visualized interactively. Some address how these data points exist in the Census ecosystem, while others are technical opportunities and solutions.
All code is always open to use, and open to accepting requests and changes.
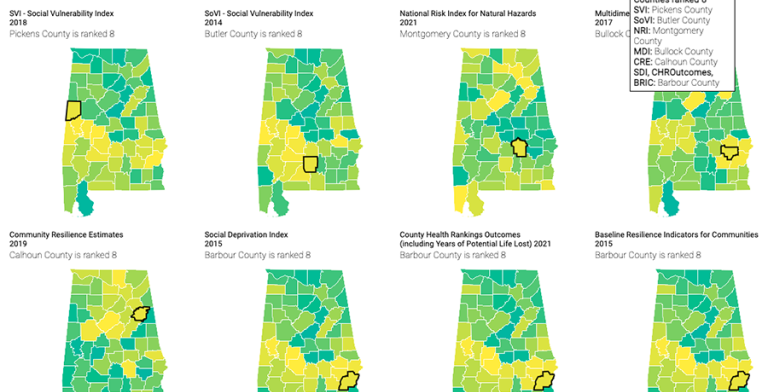
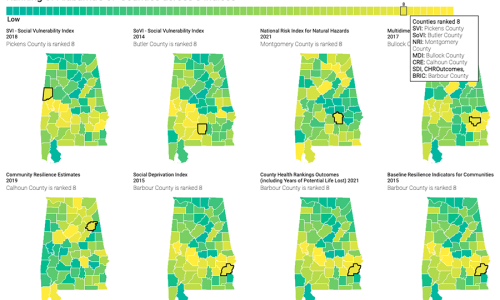
This project compares data for 8 national indices, as well as the census measures that go into 15 additional indices to provide an overview of how indices are made, by whom, and for what purpose.
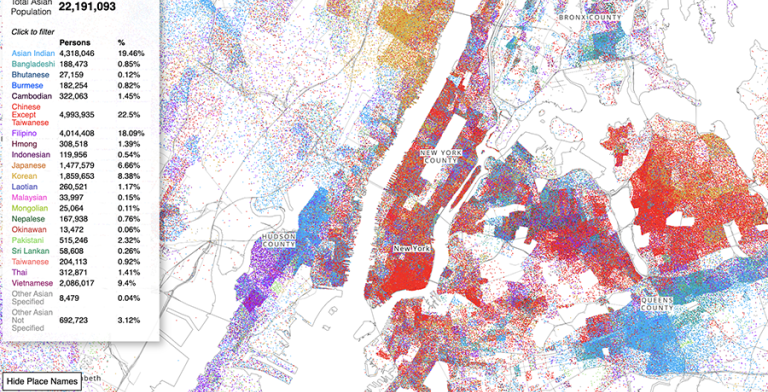
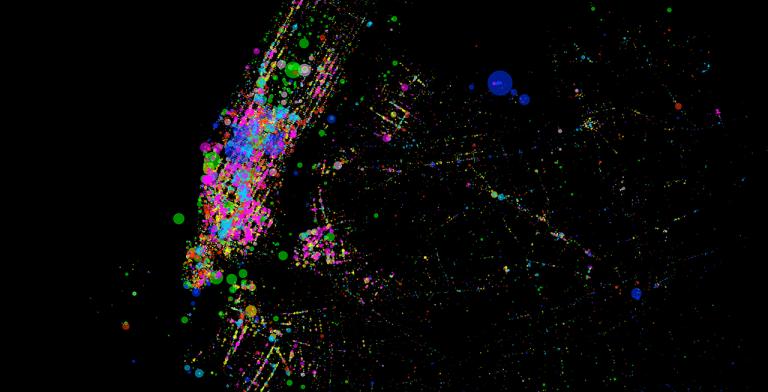
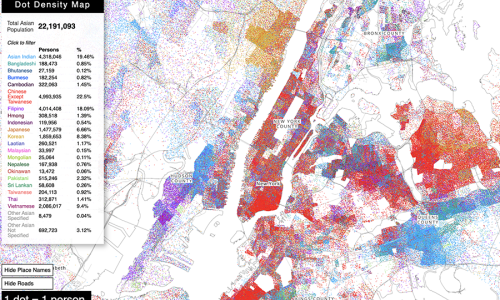
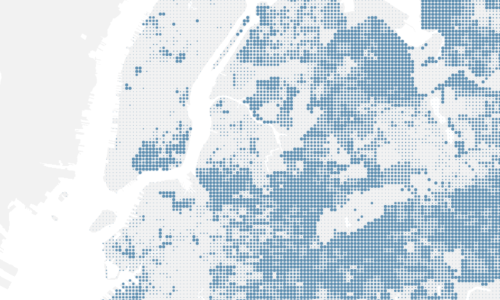
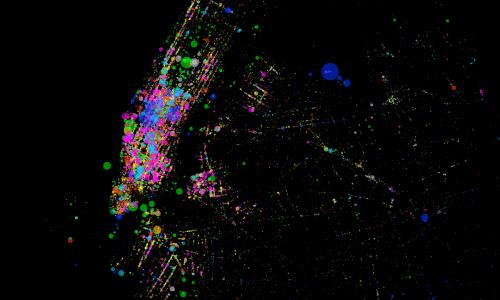
The Asian American Dot Density map represents each Asian American as 1 dot color coded by 21 different racial groups found in Census data. The map reveals the complex spatial dynamics of specific asian racial groups in places across the country.
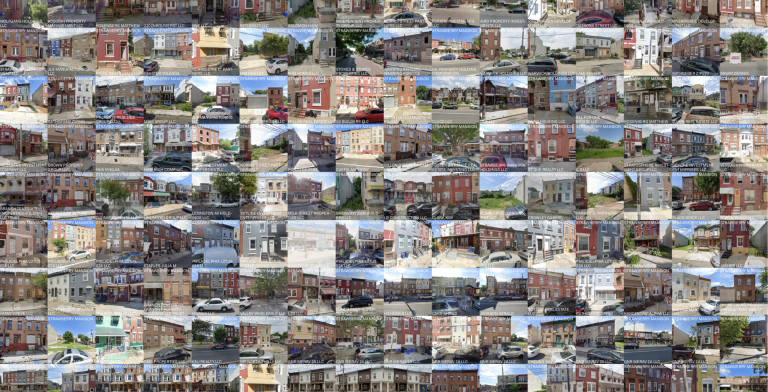
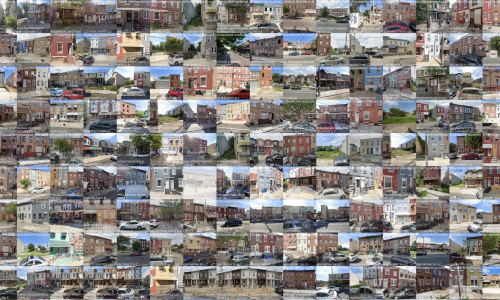
This project investigates forms of investment in residential property that began to emerge in the lead up to the 2008 financial crisis, which have since morphed and firmly taken hold. Focused on Philadelphia, PA, the analysis traces the new geographies of real estate purchases made specifically by investors who do not intend to live in the homes they are buying.
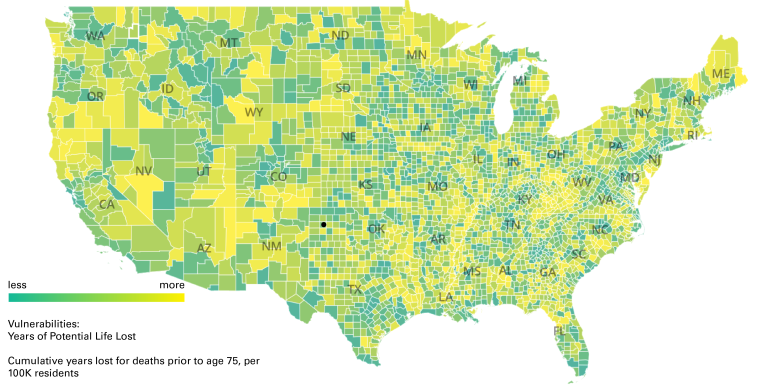
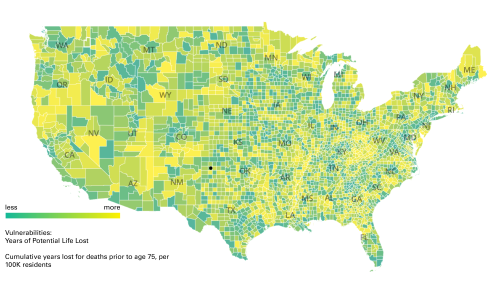
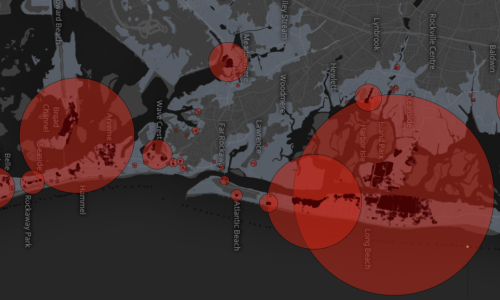
Mapping the New Politics of Care is a visual journey through the inequities and vulnerabilities that define the American landscape, using different definitions to describe communities at risk, down to the county level. The project is also designed to show visitors how the areas that appear most at risk within each state shifts depending on how vulnerability is measured: from COVID-19 cases to unemployment rates, from COVID-19 deaths to formal metrics of health vulnerability such as Years of Potential Life Lost and the Centers for Disease Control and Prevention’s Social Vulnerability Index.
An exhibit focusing on the urban origins of the term homophily, its formalization and proliferation through the algorithmic logics of online networks, and the risks we run when it becomes not just a descriptive model but a prescriptive rule for social life. On view at the Chicago Architecture Biennial September 18,2019 – January 5, 2020.
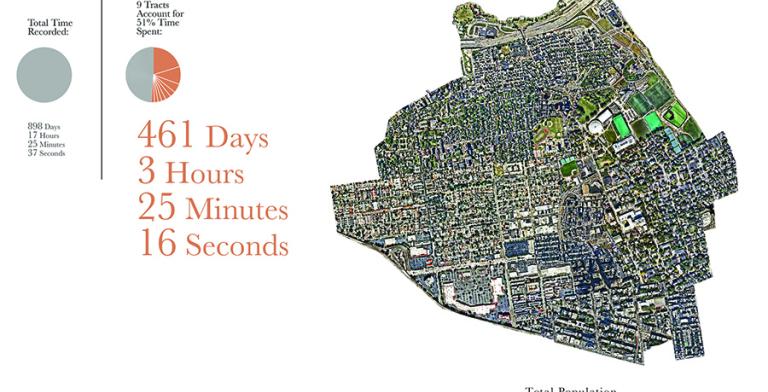
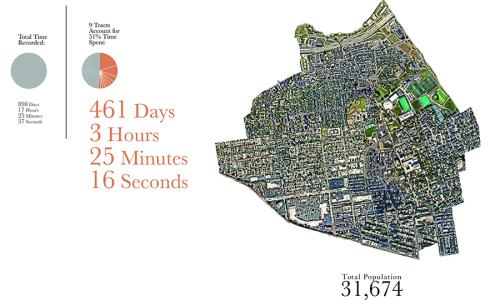
This project visualizes the U.S. Census through the lens of 1 person’s location data over the course of 3 years. It addresses the potential of self quantification in the personalization of public aggregate data. We are constantly viewed through data collected from us. However, despite the increasing nuance and sophistication of classification and categorization systems, the formalization of categories is always going to be playing catch up to how we can define ourselves. Is it possible that we can challenge the transactional nature of our current relationship with data by viewing aggregate data through the lens of self knowledge?
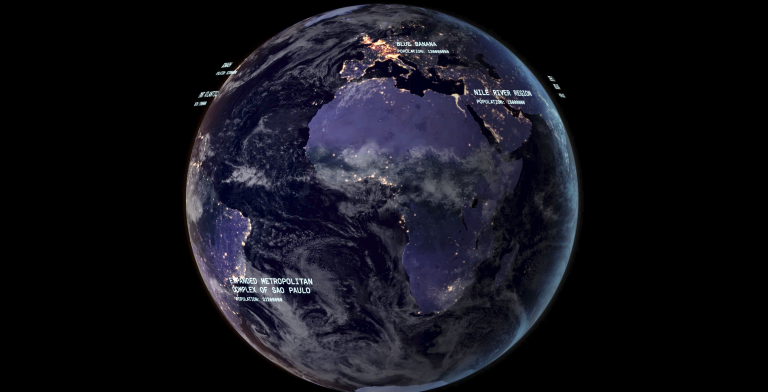
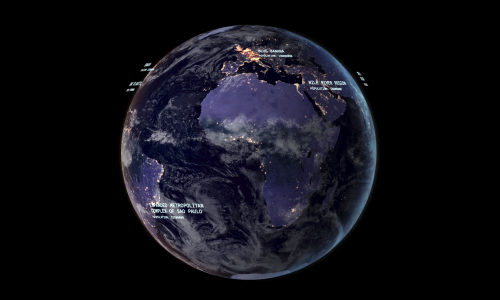
In Plain Sight presents anomalies in population distribution seen in nighttime satellite imagery of Earth and census grid counts produced by governments worldwide — revealing places with bright lights and no people and places with people and no lights—thus, challenging our assumptions about geographies of belonging and exclusion.
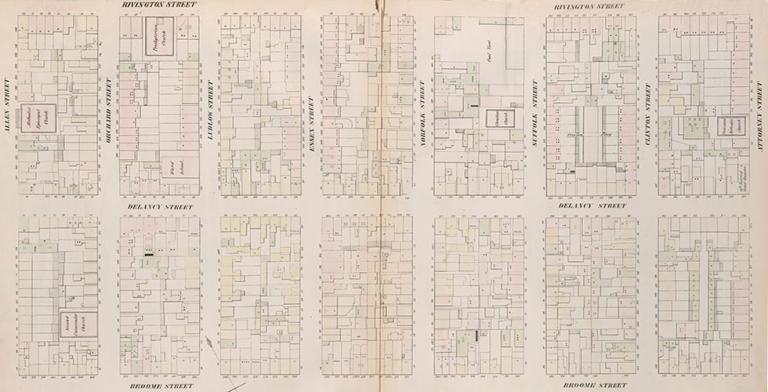
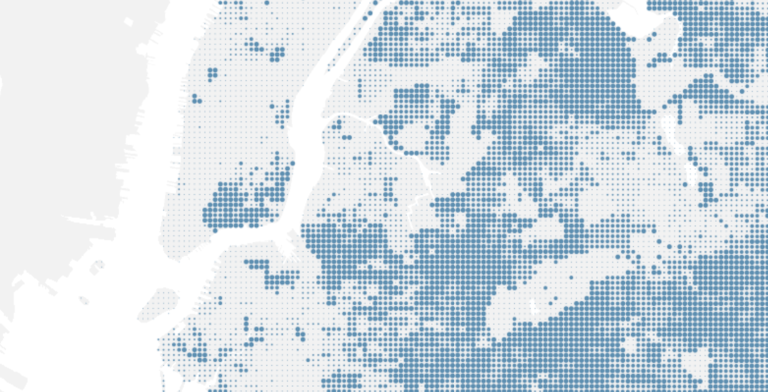
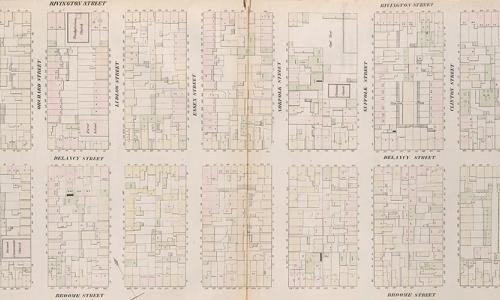
Mapping Historical New York: A Digital Atlas visualizes Manhattan’s and Brooklyn’s transformations during the late-nineteenth and early-twentieth centuries. Drawing on 1850, 1880, and 1910 census data, it shows how migration, residential, and occupational patterns shaped the city.
We Can is a multimedia storytelling project that explores the lives and activity of canners, people who pick up cans and bottles on NYC streets. We combined oral history, manual data collection, mapping and illustration to encourage a more critical observation of a community and its subculture. The mapping component consists in GPS tracked canners’ daily itineraries that unfold, while revealing the quantitative and qualitative data collected manually.
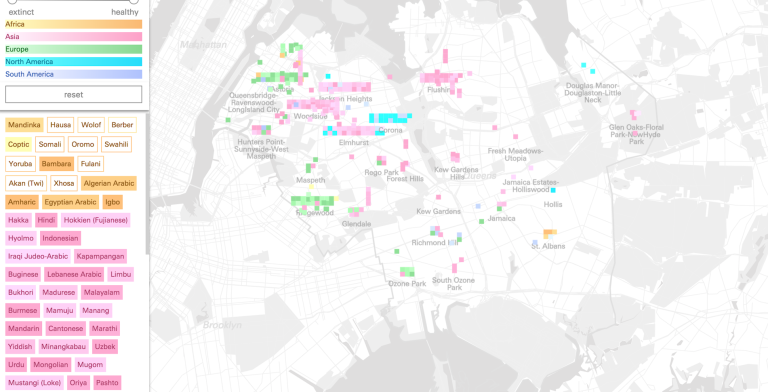
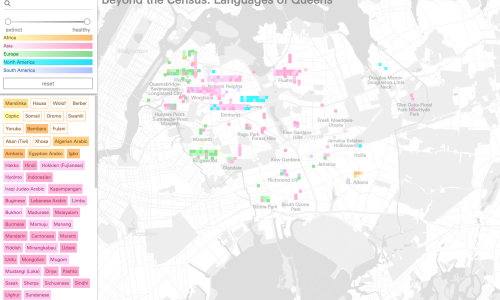
Conflict Urbanism: Language Ecologies explores the role that language plays in shaping urban space. Language interacts with its environment at multiple scales and with diverse media. As an ecology, language either dominates, or is vulnerable to its host environments. In this way it often makes conflict visible in urban settings.
One of the biggest challenges facing science journalists is the ability to quickly contextualize journal articles they are reporting on deadline. Science Surveyor is a tool that can help science journalists and others rapidly and effectively characterize the scientific literature for any topic by providing a contextual consensus, and a timeline of publications surrounding the topic.
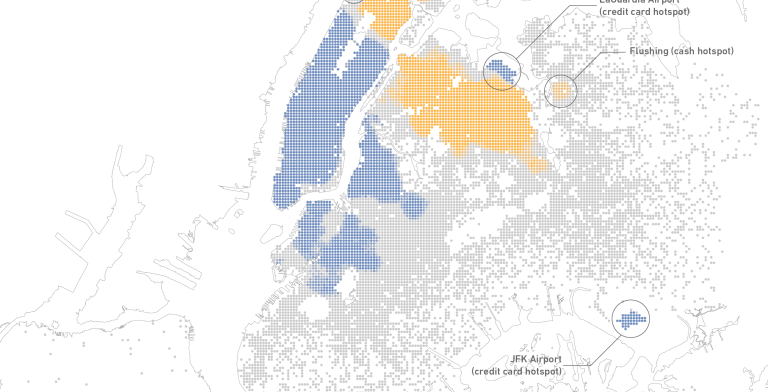
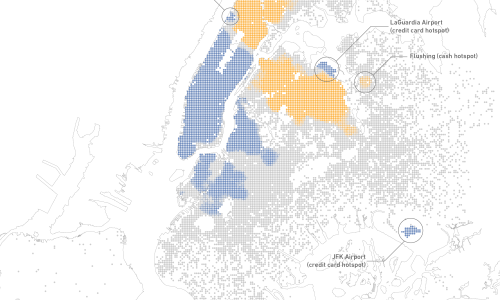
The Banking Divide For Taxi Access: Evidence From New York City
Since 2008 yellow taxis have been able to process fare payments with credit cards, and credits cards are a growing share of total fare payments. However, the use of credit cards to pay for taxi fares varies widely across neighborhoods, and there are strong correlations between cash payments for taxi fares, cash payments for transit fares and the presence of unbanked or underbanked populations. In this paper we use multiple datasets to explore taxicab fare payments by neighborhood and examine how access to taxicab services is associated with use of conventional banking services.
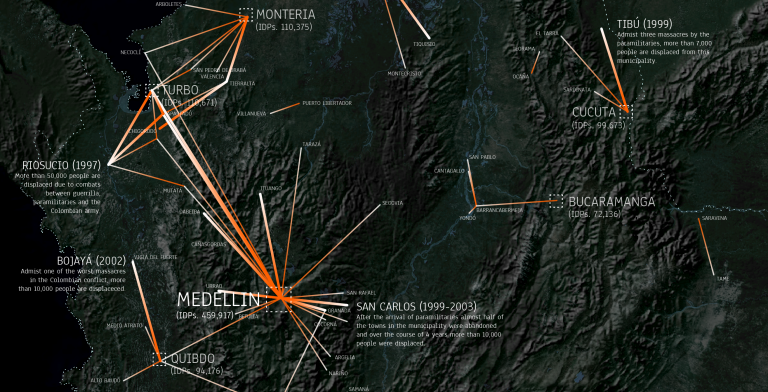
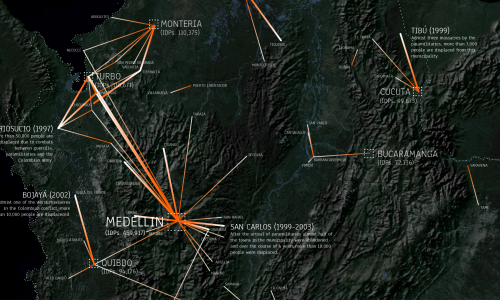
On the eve of an historic and controversial peace agreement in Colombia we have launched an investigation into the spatial characteristics of the decades long conflict between multiple state and non-state actors in the country. We have provisionally titled this research Conflict Urbanism: Colombia. We analyze and visualize the documented aspects of the conflict in Colombia in order to put forward policy recommendations for the transitional justice and peacebuilding process.
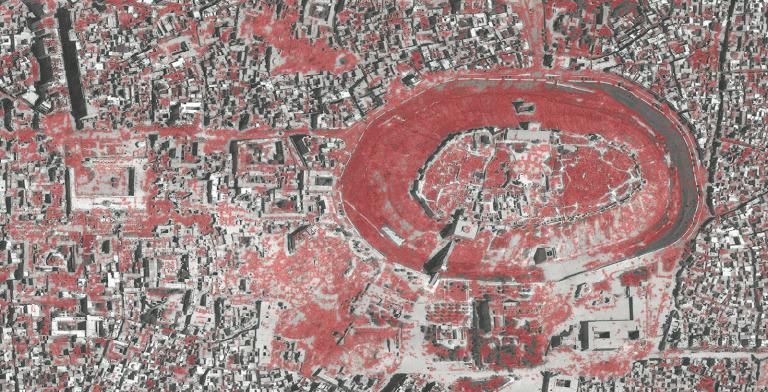
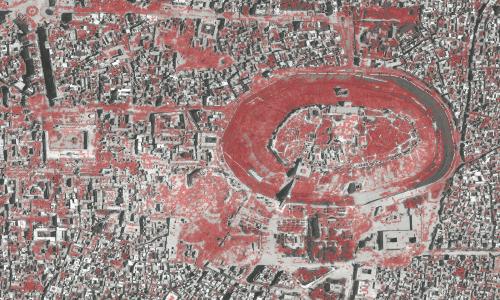
Conflict Urbanism: Aleppo is a call for inquiry and a call to action. It is an open-source, interactive, data-rich map of the city of Aleppo, at the neighborhood scale. Users can navigate the city, with the aid of high resolution satellite imagery from before and during the current civil war. It is also an invitation to students and other collaborators to record and narrate urban damage in Aleppo — at the cultural, infrastructural, or neighborhood scale — and to present that research in case studies which will be added to the website over time.
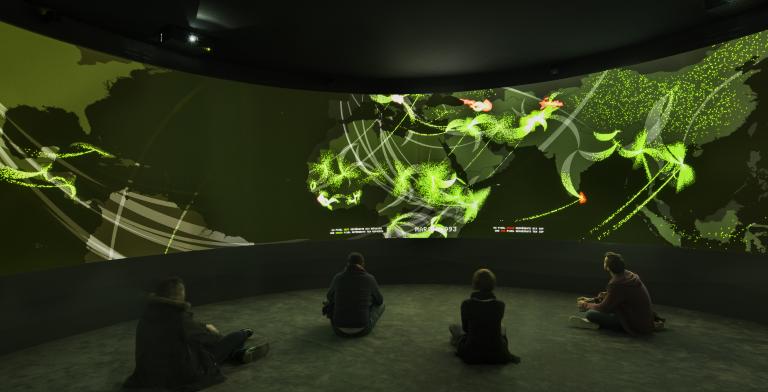
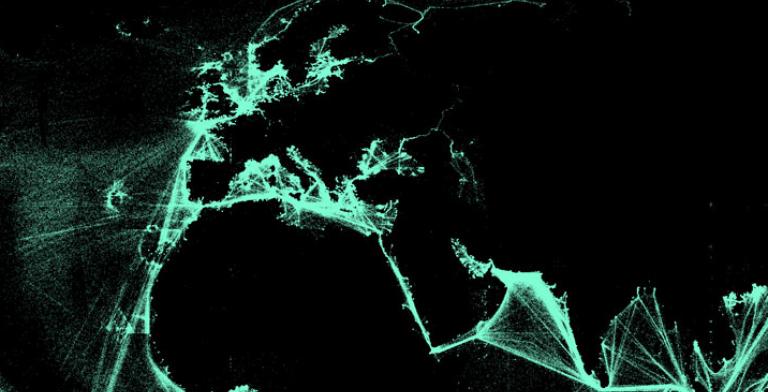
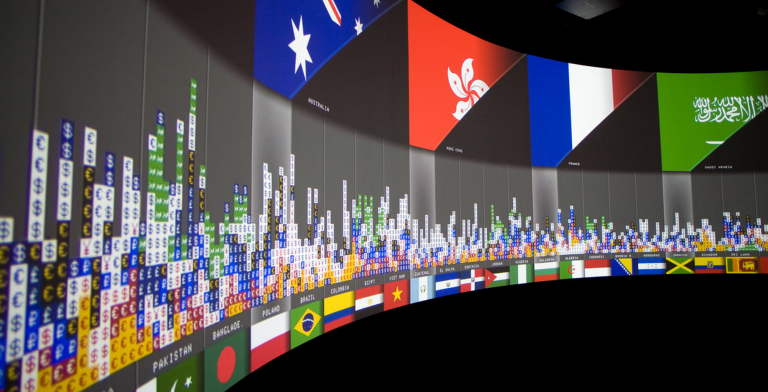
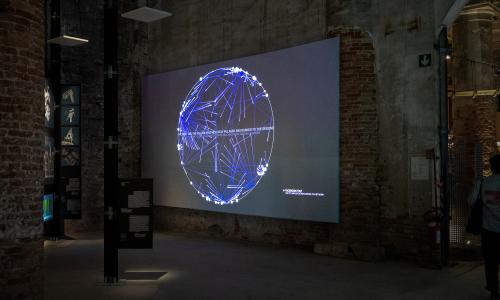
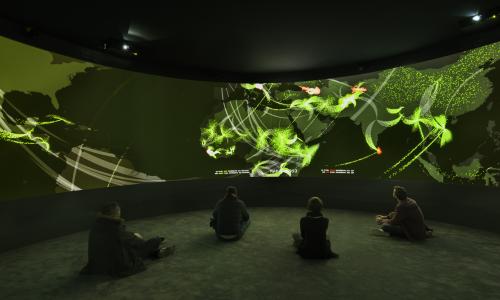
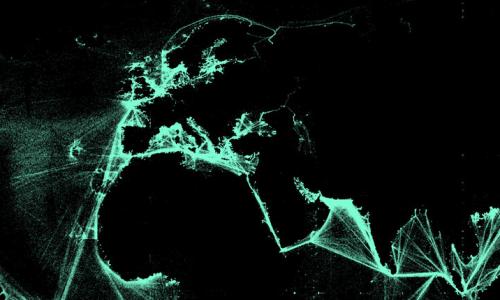
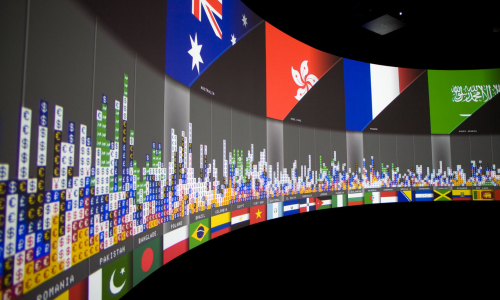
Exit is an immersive installation that investigates global human migrations. The maps are made from data which has been collected from a variety of sources, geocoded, statistically analyzed, re-processed through multiple programming languages and translated visually. Updated to coincide with Cop21 it was exhibited at Palais Tokyo from November 25, 2015 – January 10, 2016.
This project is an analysis of New York City neighborhoods according to specific health, demographic and environmental metrics. We worked with the New York Restoration Project (NYRP), which is developing a master plan to renovate a network of open spaces in Mott Haven and Port Morris in the South Bronx. Over the next several years, NYRP will fund the renovations and build them. As a first step, we will capture baseline health data and quality of life indicators which we will track as the project progresses.
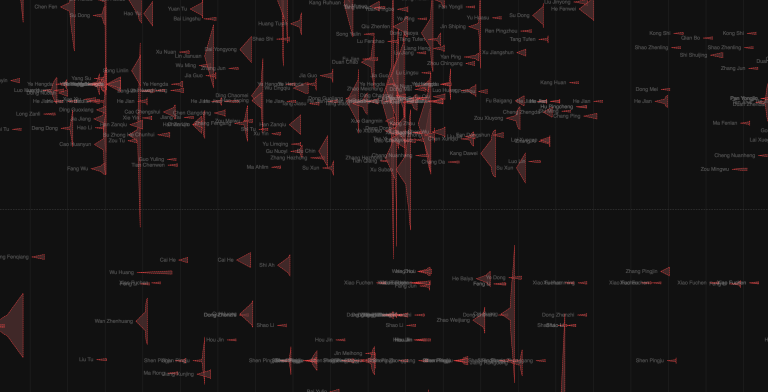
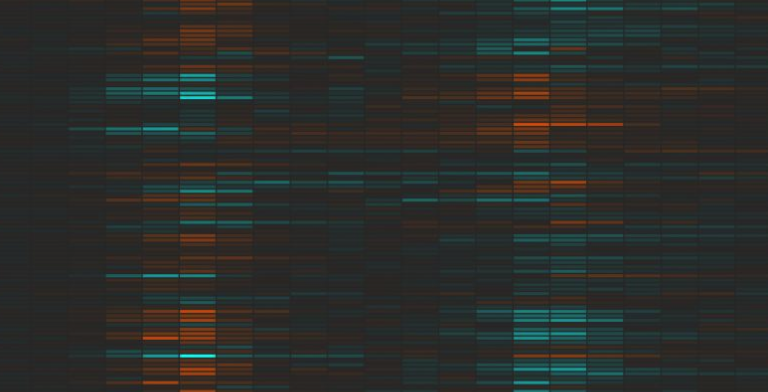
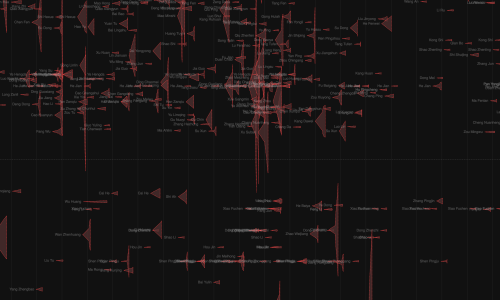
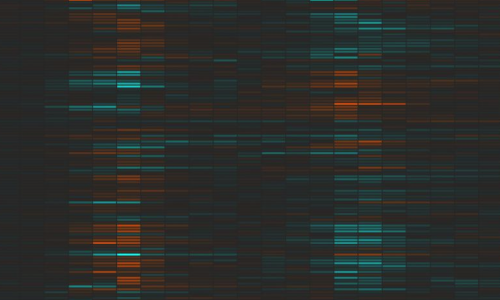
This project visualizes a relatively new phenomenon: online free expression in China. It examines some innovative strategies employed by users of Weibo, a Twitter–like micro–blogging platform, in order to avoid government censorship bloggers post images as text. Images are much more difficult for automated search programs to analyze, which allows image-based content to spread more widely before it is detected and removed. Taking advantage of this, some users now turning writing into images, taking screenshots of their own and others' controversial posts before they're removed, then posting and re–posting them. The project visualizes Weibo posts that were posted and deleted between September 8th to November 13th, in 2013.
Using D3 as an interactive web platform we designed a map interface that is scaled globally while embedded with local stories about energy movement from port to port. Data can be viewed across time, which reveal changes in patterns of movement as the geopolitics, price of oil, and conditions at specific ports change.
In collaboration with Thomson Reuters Research Unit.
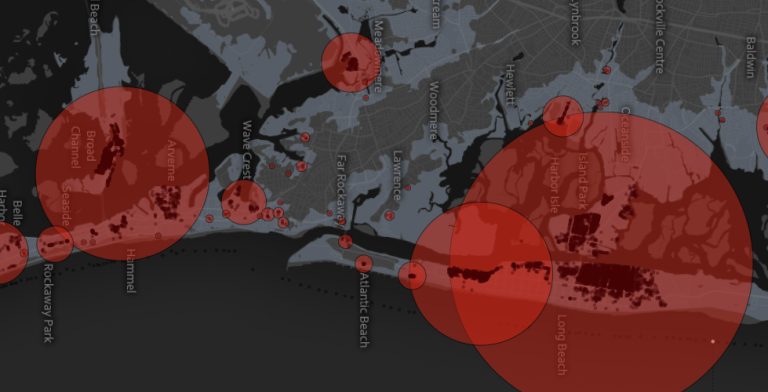
Superstorm Sandy made landfall in New Jersey on October 29th. Data generated by governments and volunteers in the weeks following the storm stand to provide critical insight into how the region was affected. These pages make such data visible, and serve as launching pad for further investigations and questions of the impact of the storm.
As has been recently documented by the press, one of the major challenges that Citi Bike is facing is the rebalancing of their stations. As origins and destinations of Citi Bike trips are not necessarily symmetrical during the day, Citi Bike has been forced to constantly move bikes around the city, taking them from full stations and delivering them to empty ones. This problem is both financially expensive and frustrating for Citi Bike users: many people complain about either not finding bikes at their stations of origin or not finding empty spots when they arrive at their final destinations.
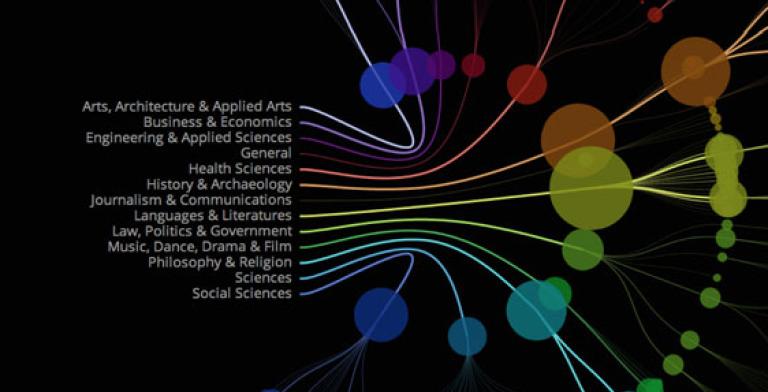
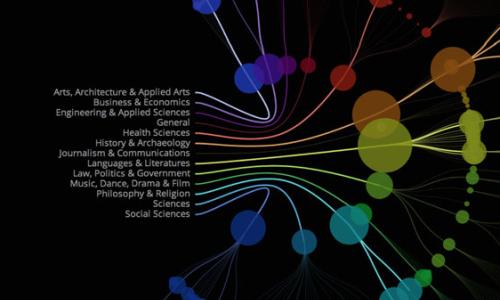
Today, when one walks into a library, whether public or private, there is no way to comprehend the immensity, character and value of its collection. Perhaps this is visible in the vastness of the stacks, or of the building, but for the most part, the collection remains invisible. “Serendipity Search” will allow for surfacing of books and other media stored in the library, into the hands of researchers and interested individuals through a more compelling and curiosity-provoking interface. In our current prototype, at the first level, we have visualized the Columbia Libraries collection in a single interactive interface. At the second level, we have designed our first tool which browses library book which have multiple subjects in their metadata.
Our design for this space includes exhibits, visualizations and story-telling components, and draws upon the disciplines of architecture, journalism, art, psychology, education, design and more. The goal of the initiative is to create a networked public space that will actively engage, and be genuinely accessible to, a heterogeneous population of visitors, including resident scientists and community members alike.
Social media are increasingly becoming part of our everyday lives, from connecting with friends and sharing images to exploring cities through location-based applications. These new services have given us a different vantage point from which to understand, explore, navigate, and geographically record the places we live. This project explores the new geogrphies produced by these new services through a series of maps.
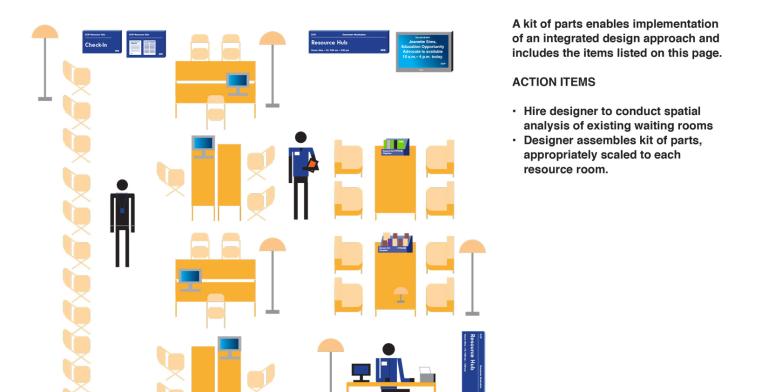
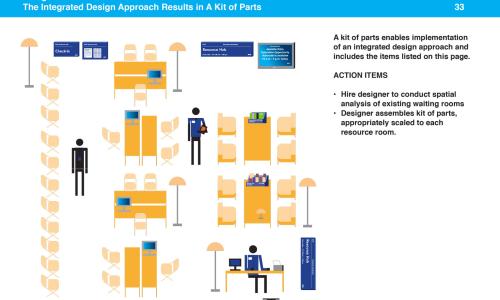
Laura Kurgan worked with the Department of Probation in New York City and the Mayor’s Office of Operations, and designed a participatory process which over a period of three months resulted in a report which proposed recommendations for the redesign of probation waiting rooms – processes and design - across New York City. As public places of service in New York City, the DOP “waiting rooms” -- to be redesigned as Resource Hubs -- will become a visible example of changes being made agency-wide to improve the culture of probation and its city-wide infrastructure, policies and processes -- physical and systemic.
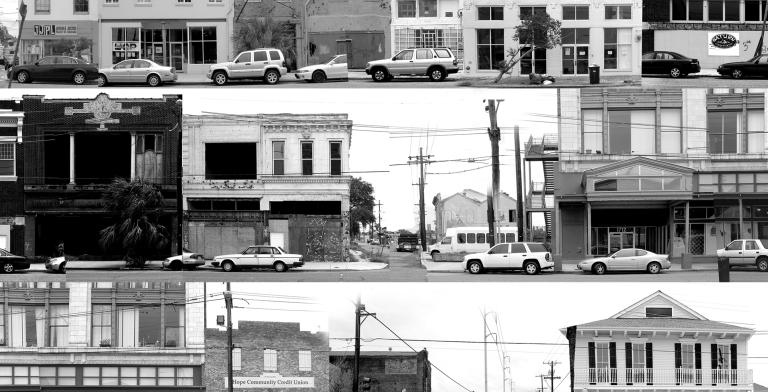
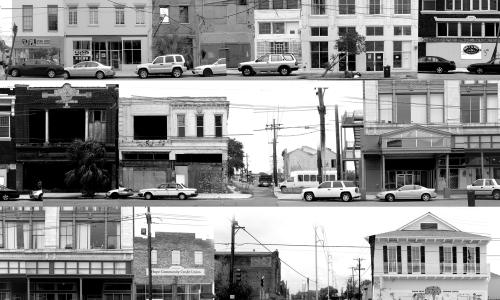
Linking Prisoner Reentry to Community Rebuilding in Post-Katrina New Orleans:
In the summer of 2006 SIDL received a grant to further their work in Justice Mapping into a real world application at an architectural scale. A group of five graduate students received fellowships to travel to New Orleans with Professor Kurgan to come up with a vision plan for a high incarceration neighborhood in New Orleans from the perspective of Justice Reinvestment. This work was continued by 2nd year architecture students in the studio in the Spring of 2007. We gave a presentation to City Council, June 12th 2007. Final documentation of this work was published in 2009.
Exits, a panoramic multi-media installation which was on view at the Cartier Foundation in Paris, France from November 2008 – March 2009 as part of “Elsewhere starts here,” conceptualized by Paul Virilio. The project was part of a larger exhibition, Terre Natale: Stop Eject.
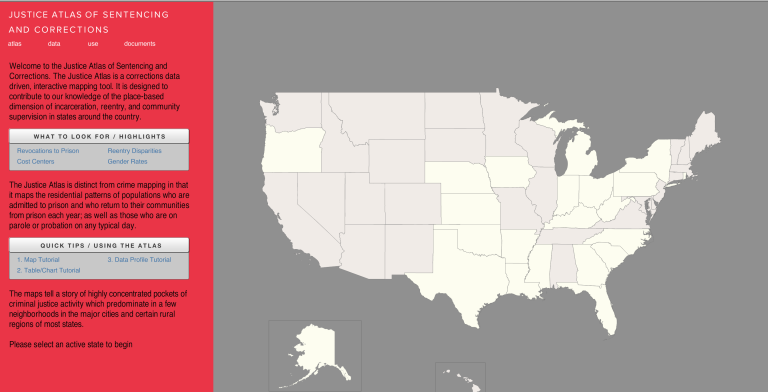
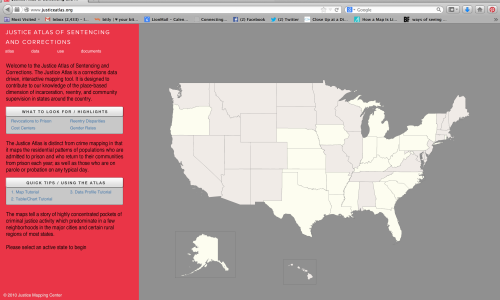
The Justice Atlas is distinct from crime mapping in that it maps the residential patterns of populations who are admitted to prison and who return to their communities from prison each year; as well as those who are on parole or probation on any typical day. The maps tell a story of highly concentrated pockets of criminal justice activity which predominate in a few neighborhood in the major cities an certain rural regions of most states.
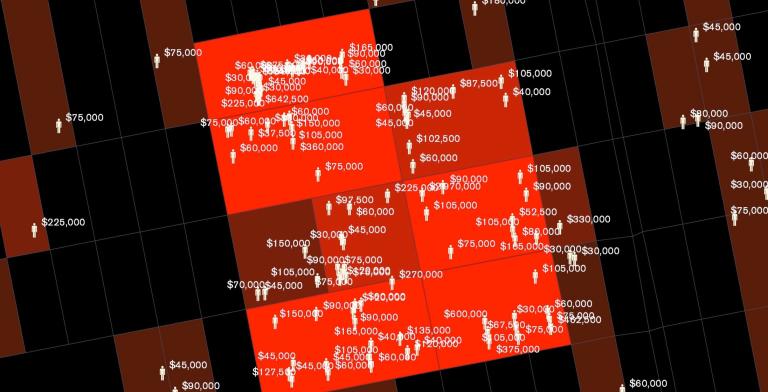
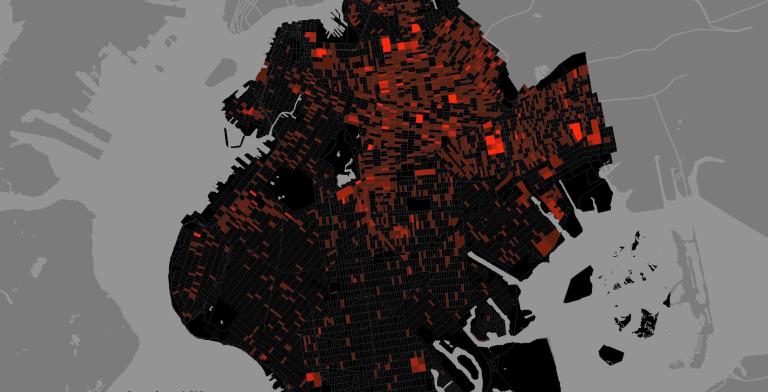
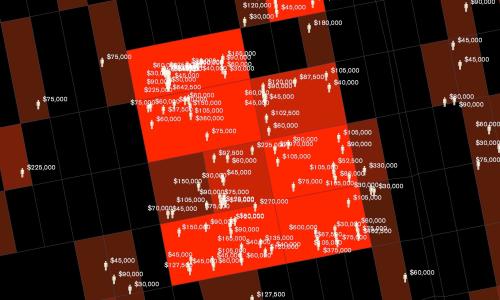
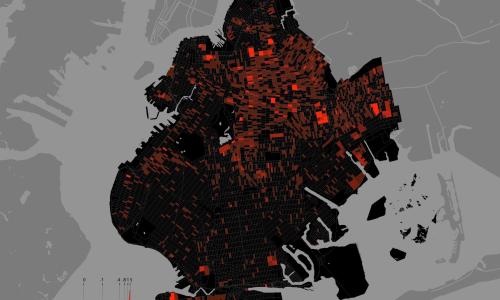
The United States currently has more than two million people locked up in jails and prisons. A disproportionate number of them come from a very few neighborhoods in the country’s biggest cities. In many places the concentration is so dense that states are spending in excess of a million dollars a year to incarcerate the residents of single city blocks. Using rarely accessible data from the criminal justice system, the Spatial Information Design Lab and the Justice Mapping Center have created maps of these “million dollar blocks” and of the city-prison-city-prison migration flow for five of the nation’s cities.