Census Experiments
Interactive visualizations dealing with Census data, Census data structures, and other Census outputs.

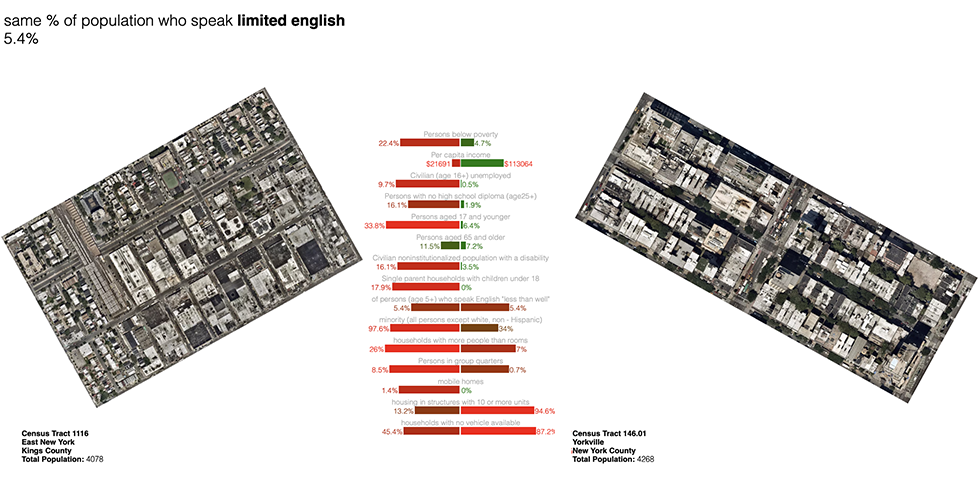
A pair of Census tracts that are similar by 1 definition but different by others
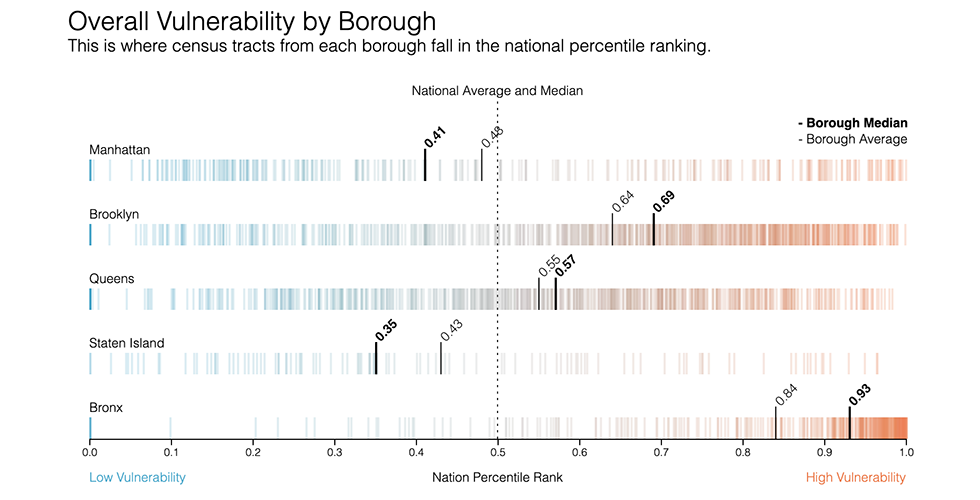
The Social Vulnerability Index for New York City
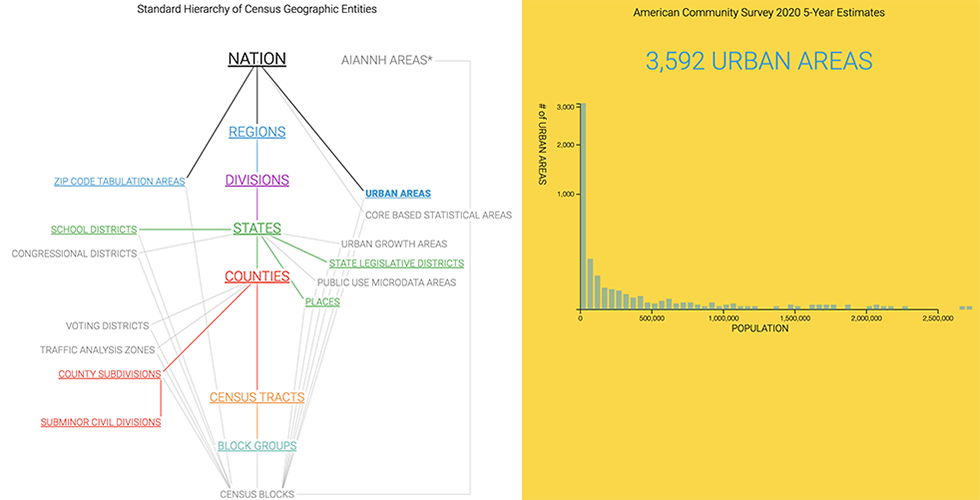
Census hierarchy diagram made interactive with population data
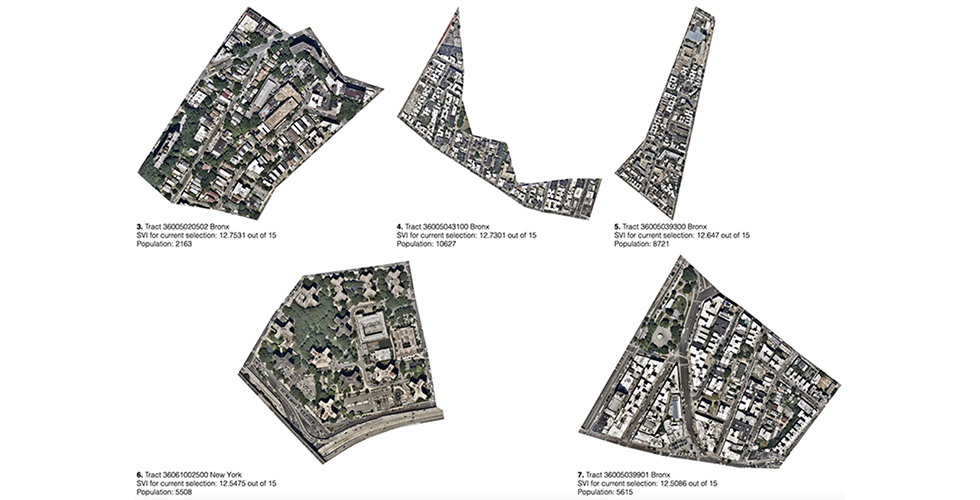
Satellite images of Census tracts sorted by different vulnerability metrics


These experiments deal with how Census data is structured, packaged, and how it can be visualized interactively. Some address how these data points exist in the Census ecosystem, while others are technical opportunities and solutions.  

All code is always open to use, and open to accepting requests and changes.
Explore this project here.