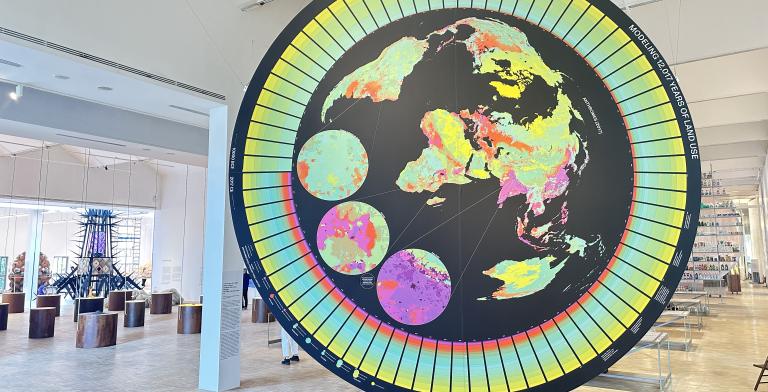
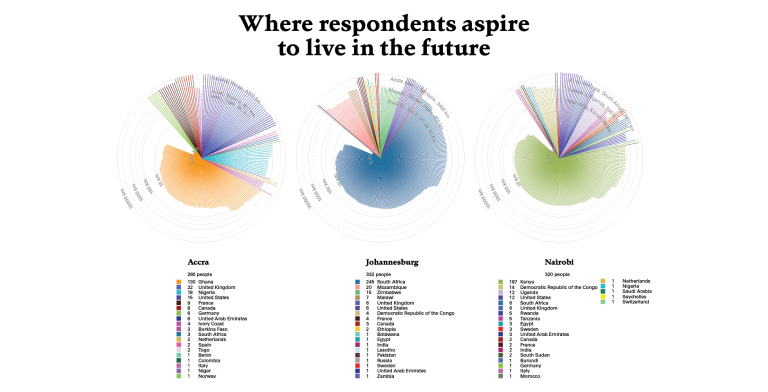
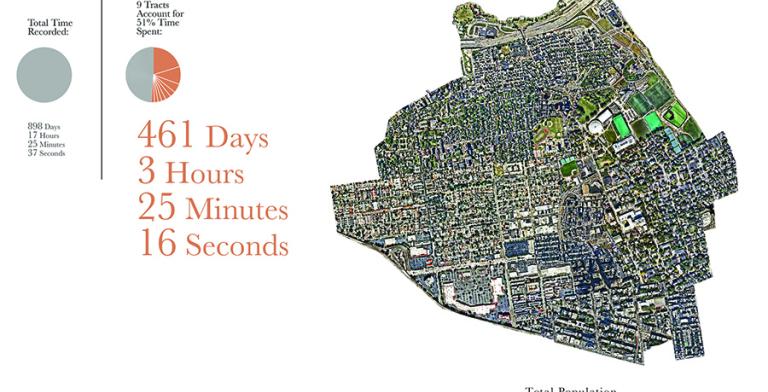
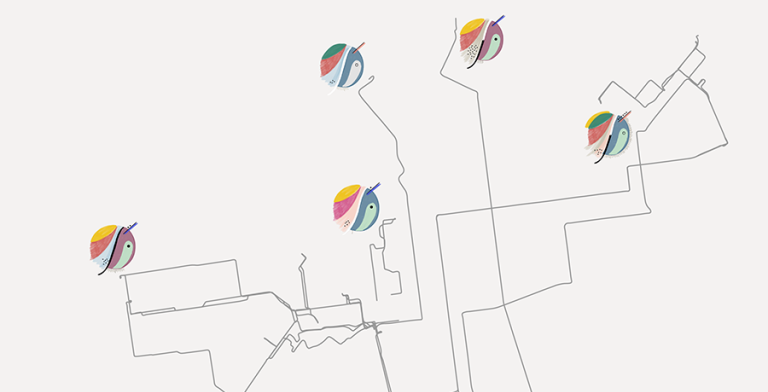
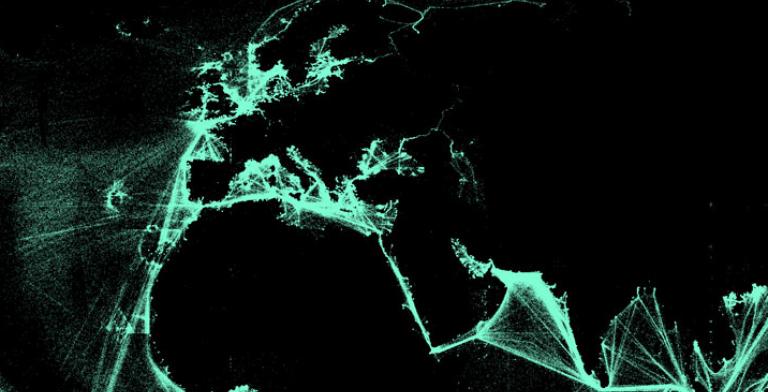
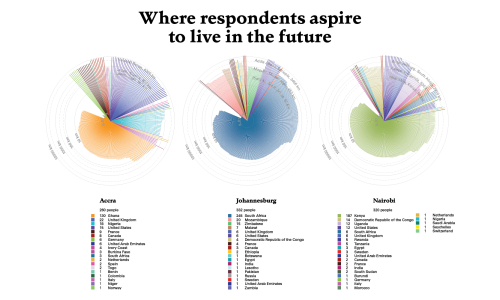
In an era of increased fluidity, political devolution, institutional fragmentation, and economic and environmental precarity, African cities are reshaping under a young population preparing for uncertain futures. This project seeks to understand the emerging patterns of human mobility, urbanism, and socio-political changes through extensive surveys in Accra, Nairobi, and Johannesburg, conducted by the African Centre for Migration and Society (ACMS). It visualizes residents' connections to place and captures the intricacies of their fragmented and uncertain lives. This research, in collaboration with the University of the Witwatersrand, aims to generate data for further academic exploration, policy reconsideration, and to enhance understanding of spatial inequality and future politics in Africa.
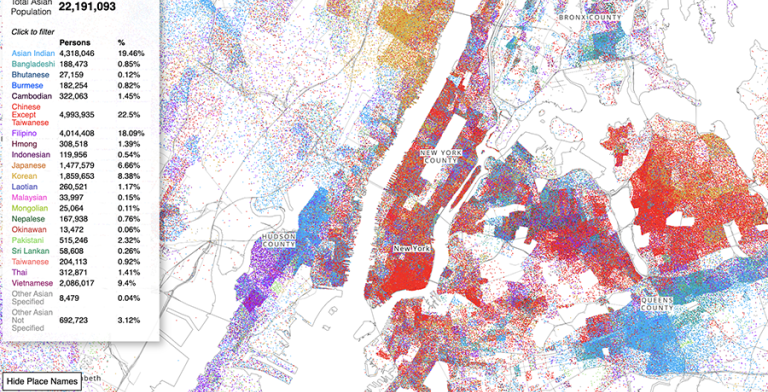
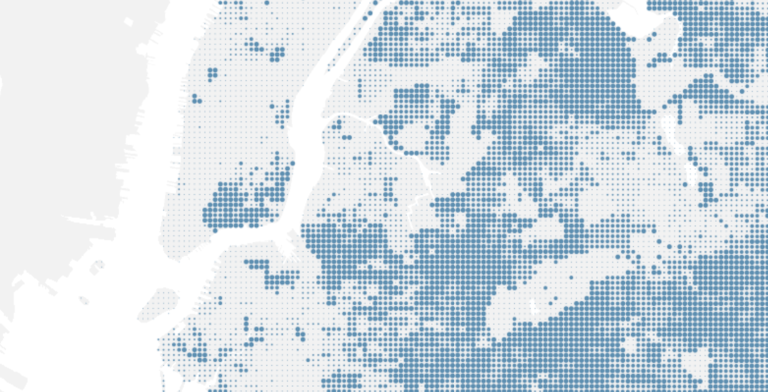
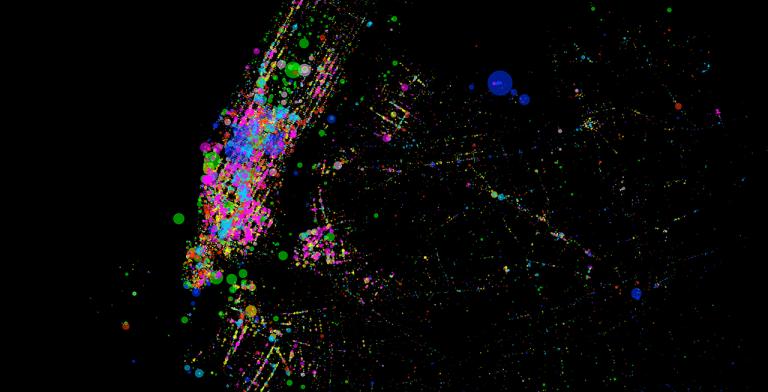
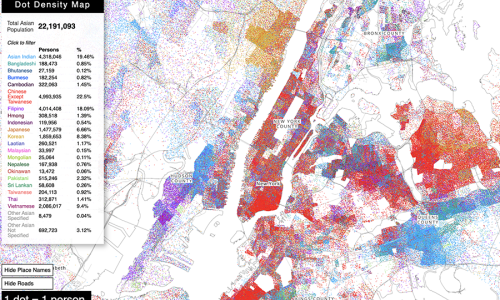
The Asian American Dot Density map represents each Asian American as 1 dot color coded by 21 different racial groups found in Census data. The map reveals the complex spatial dynamics of specific asian racial groups in places across the country.
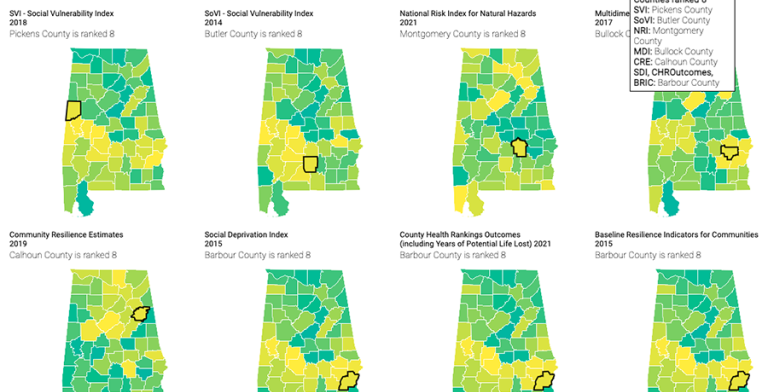
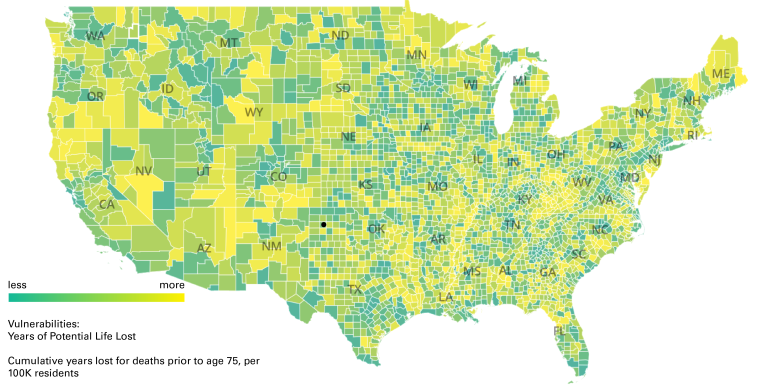
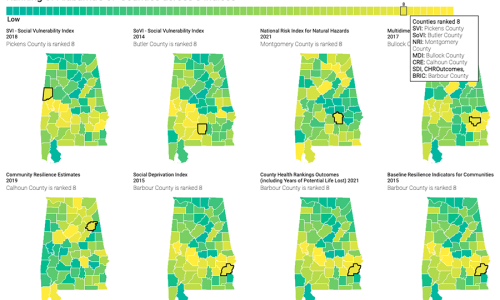
This project compares data for 8 national indices, as well as the census measures that go into 15 additional indices to provide an overview of how indices are made, by whom, and for what purpose.
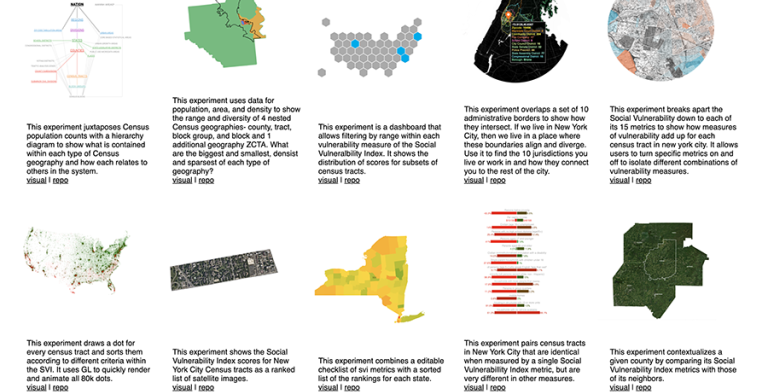
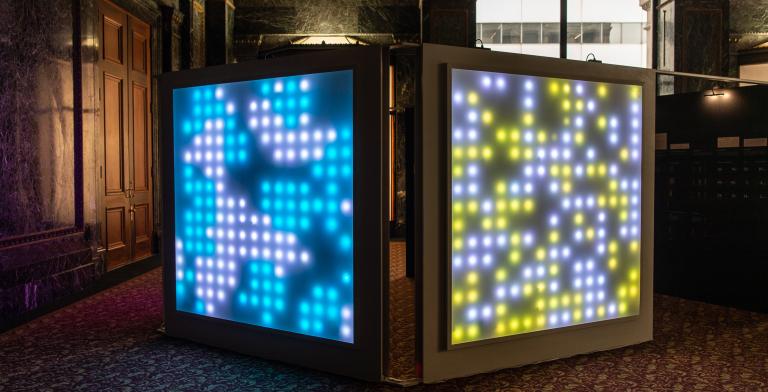
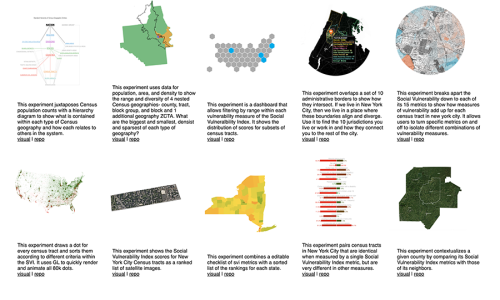
These experiments deal with how Census data is structured, packaged, and how it can be visualized interactively. Some address how these data points exist in the Census ecosystem, while others are technical opportunities and solutions.
All code is always open to use, and open to accepting requests and changes.
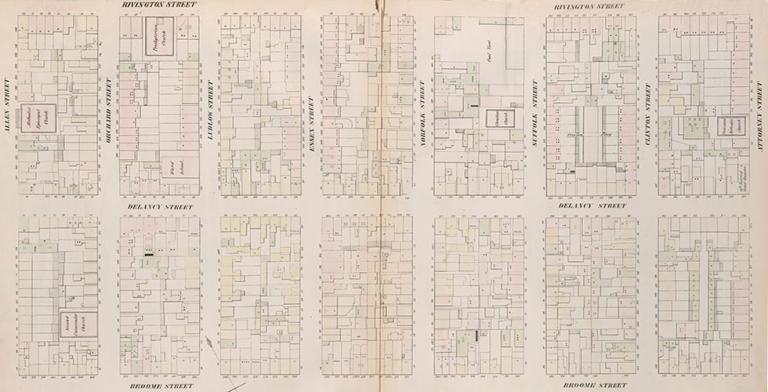
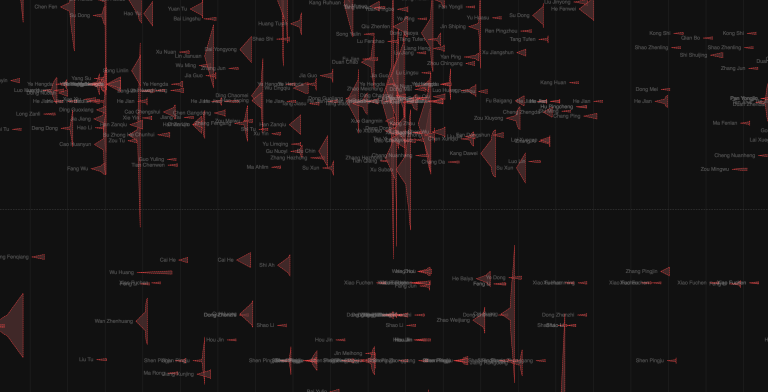
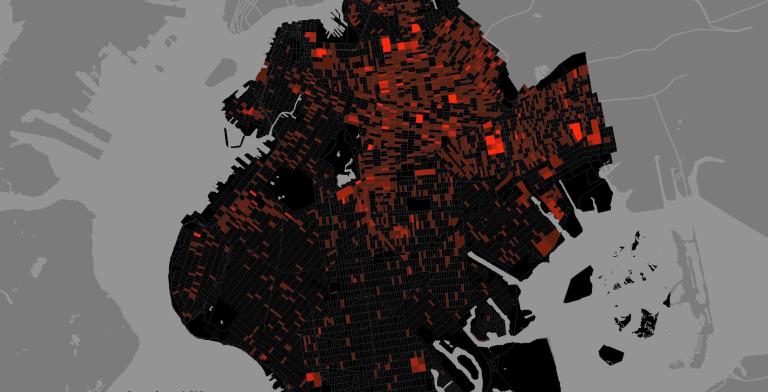
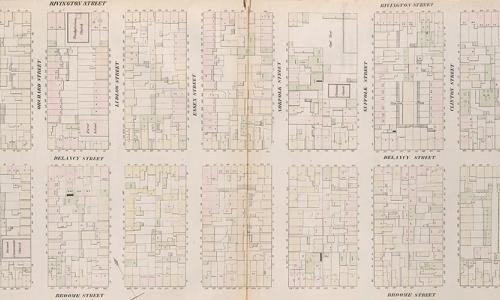
Mapping Historical New York: A Digital Atlas visualizes Manhattan’s and Brooklyn’s transformations during the late-nineteenth and early-twentieth centuries. Drawing on 1850, 1880, and 1910 census data, it shows how migration, residential, and occupational patterns shaped the city.