| Working with Projections |
Mapping for Architecture, Urbanism and the Humanities |
QGIS 2.18 |
GIS, Mapping |
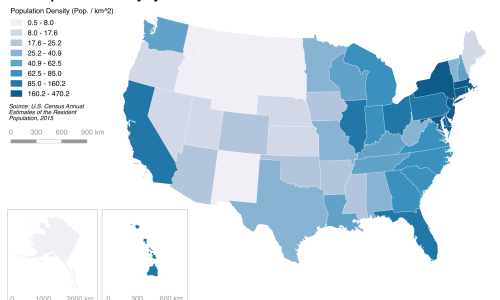
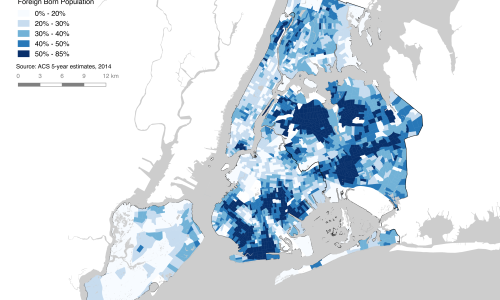
Projections enable us to represent the earth on a flat surface. This tutorial will walk through the process of creating a U.S. population density map in the Albers equal-area conic projection, a standard way of representing the United States with minimal distortion.
|
| Tutorial 0: Getting Started |
Mapping for Architecture, Urbanism and the Humanities |
QGIS 3.4 |
GIS, Mapping |
This tutorial will introduce you to the QGIS interface, exploring a environment and a handful of its options. In doing this, we will set up the layers needed for the first tutorial (Tutorial 1)., exploring the QGIS environment and a handful of its options. In the process, we will start and save a map project, add vector- and raster-based spatial data to the map project, access the Attribute Table of a vector layer, change the symbology of a vector layer using qualitative attributes, and learn the basics of working with map projections.
|
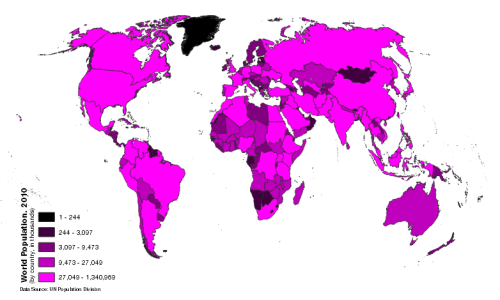
| Mapping Data: World Populations |
Mapping for Architecture, Urbanism and the Humanities |
QGIS 2.18 |
GIS, Mapping |
With this exercise, you will learn introductory skills involved in using QGIS to map existing spatial datasets. Using an example of world populations you will have become familiar with the QGIS user interface, learned the components of shapefiles, created a clear and effective map composition, critically considered symbology and classification and the differences, between mapping qualitative and quantitative information, created and calculated new fields in an attribute table, performed a table join to, combine additional data to an existing shapefile’s attribute table, queried a GIS dataset, using both tabular queries and spatial queries.
|
| Making Data: Aggregating 311 Complaints |
Mapping for Architecture, Urbanism and the Humanities |
QGIS 2.18 |
GIS, Mapping |
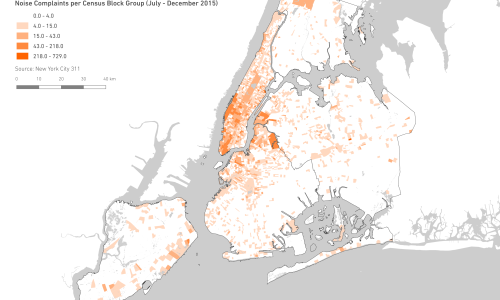
In this tutorial, you will: download 311 data for New York City, create a categorical and a quantitative map of this data, join the 311 data to another spatial dataset (census block groups) to aggregate it and display it based on its geographical location.
|
| Working with U.S. Census Data |
Mapping for Architecture, Urbanism and the Humanities |
QGIS 2.18 |
GIS, Mapping |
This tutorial will guide you through the process of downloading both the geographical boundaries and the census data, bringing them both into QGIS and joining them, and creating a choropleth map.
|
| Web Mapping 1 |
Mapping for Architecture, Urbanism and the Humanities |
CSS, HTML, Javascript, Mapbox GL |
GIS, Mapping |
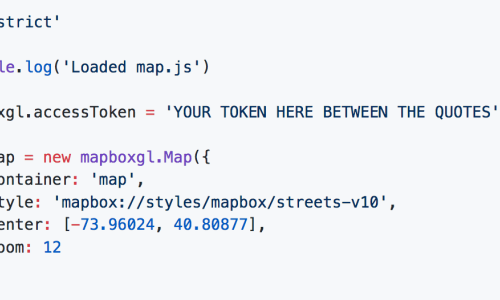
We are going to be making web maps using Mapbox GL JS. This is a recent javascript library that uses WebGL to render interactive maps from vector tiles (as opposed to raster tiles) created with Mapbox Studio. Data for these maps comes from OpenStreetMap.This tutorial will introduce you to the basic setup and what it feels like to develop for a web browser. This will be a very different approach than our experience with QGIS, and it is much more prone to error given the number of new concepts and syntaxes involved. Brackets, commas, quotes, and colons... stay with it—it's ok if you dont understand what everything is doing at first.
|
| Web Mapping 2: Custom Map Tiles |
Mapping for Architecture, Urbanism and the Humanities |
CSS, HTML, Javascript, Mapbox GL |
Web Mapping |
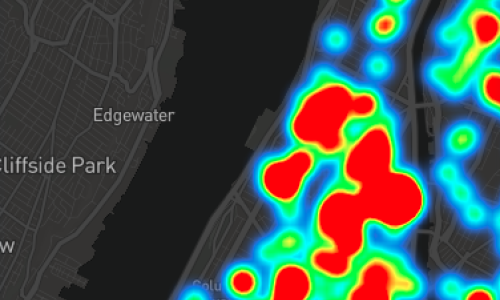
In the previous tutorial, we created markers using Mapbox GL JS by declaring them explicitly in our code. Our basemap data came from Mapbox's defaults, which in turn come from OpenStreetMap. In this tutorial, we will create a tileset using external data. Just like QGIS, Mapbox can add layers from vector, raster, and point-based information. Unlike QGIS, which works with maps at a single level of detail, Mapbox converts data to tiles which are delivered to the browser as they are needed. The data in each tile is limited to a bounded geographic area and zoom level, the result of which is that certain things can be visualized only at relevant times, rather than everything needing to be visualized all at once. This allows for the kind of interactivity we have come to expect from web maps, and it also allows us to make local calculations about the user's position in relation to data. The theme of this tutorial will be a classic element of NYC life.
|
| Web Mapping 3: GPS Drawings |
Mapping for Architecture, Urbanism and the Humanities |
CSS, HTML, Javascript, Mapbox GL |
Web Mapping |
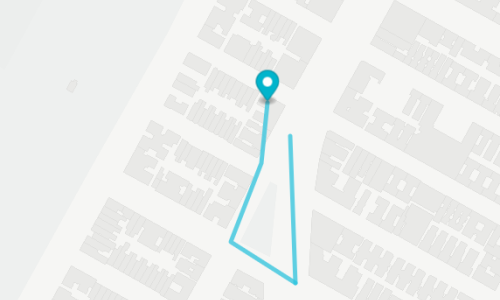
In this tutorial, we will use the sensing capacity of our devices to make GPS drawings, an activity with a rich precedent including You Are Here by CSR's Laura Kurgan, Amsterdam Realtime by Esther Polak and Jeroen Kee, and drawings by Jeremy Wood. Contemporary devices and Mapbox's API make it straightforward for us to get similar results to what was technically very challenging at the time these works were made.
|
| Analyzing Data: Introduction to Geoprocessing |
Mapping for Architecture, Urbanism and the Humanities |
QGIS 2.18 |
GIS, Mapping |
Through this exercise you will learn key tools of analysis using QGIS. After completing these exercises you should be able to use proximity based measures, understand the principles and applications of boolean operations, conduct spatial joins, explain and perform proportional split population estimates
|
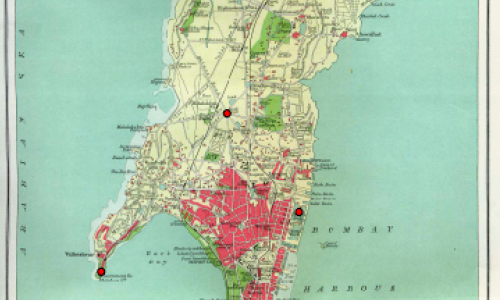
| Georeferencing: Colonial Map of Mumbai |
Mapping for Architecture, Urbanism and the Humanities |
QGIS 2.18 |
GIS, Mapping |
In this exercise, you will explore some of the georeferencing tools available in QGIS and use them to georeference a 1909 map of Mumbai, "Island of Bombay". You will learn how to use GIS tools to georectify raster datasets. You will then use the georeferenced map to digitize vector features from the map infomation.
|
| Tutorial 1: Mapping a Table |
Mapping for the Urban Humanities: A Summer Institute |
QGIS 3.4 |
GIS, Mapping |
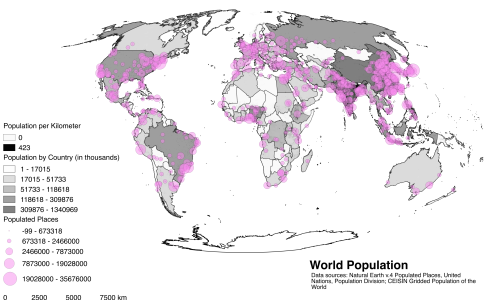
The purpose of this tutorial is to produce and export global map of population by country. For this we will use the national administrative boundaries layer in the previous tutorial, combining it with population data contained in a table. In the process, we will learn more about the QGIS interface, add a csv table to a map project, perform a table join, change the symbology of a vector layer using quantitative attributes, layout and compose a map, and export a finished map.
|
| Tutorial 2: Georeferencing a scanned paper map |
Mapping for the Urban Humanities: A Summer Institute |
QGIS 3.4 |
GIS, Mapping |
In this exercise, we will create spatial data from a scanned paper map. The first thing we need to do to transform a scanned paper map into a map that a computer can read is to georeference it. This means that we will match spots on the image with coordinates on a map. Though we will use a webmap for this (Open Street Maps), it could be done with any map that has coordinate information embedded in it. In the second part of this tutorial, we will take this georeferenced map and digitize some of the features on it to make a new dataset that can then be used with this map or imported into other projects as a shapefile itself.
|
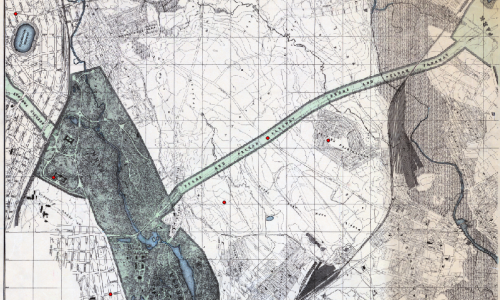
| Tutorial 3: Digitizing Features from a Georeferenced Map |
Mapping for the Urban Humanities: A Summer Institute |
QGIS 3.4 |
GIS, Mapping |
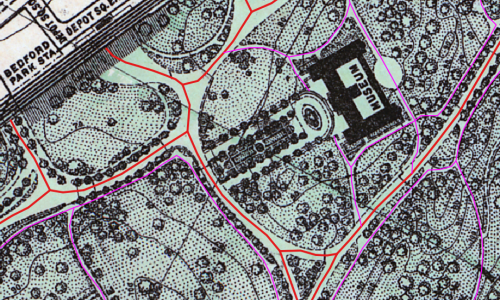
In this exercise, you will create your own dataset by outlining the trees that were represented in the "1902 map or plan of that part of the Borough of the Bronx, City of New York, lying easterly of the Bronx River" that was georeferenced in Tutorial 2. Making new data from historic maps is a fairly common, if laborious, practice. In many cases, the data we are interested in is not digitized, so we have to translate it ourselves. This process can be compared to digitizing books handwritten in script by typing them. It is time-intensitve, but sometimes, it is the only way to get the data we need in a format a computer can read. Through this tutorial, you will explore some of the on-screen hand digitizing tools available in QGIS and use them to digitize trees, paths and other features from a georeferenced map. In essence, you will be converting raster spatial data into vector-based features.
|
| Tutorial 3B: Geocoding Historic Data |
Mapping for the Urban Humanities: A Summer Institute |
QGIS 3.4 |
GIS, Mapping |
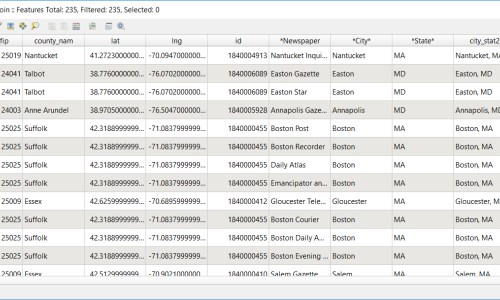
In this tutorial, you will make a map of newspapers in the United States before and after the invention of the rotary printing press in 1843. We want to visualize the effect of this technological change on the access to communication across the United States. By the end of this tutorial, you will be able to: identify types of data that can be used in GIS applications, transform data you find in a table into a csv file that can be used in QGIS, align that data to geographic locations using a gazetteer, query the data you collected to answer a research question.
|
| Tutorial 4: Telling Stories with Maps |
Mapping for the Urban Humanities: A Summer Institute |
QGIS 3.4 |
GIS, Mapping |
This tutorial outlines how to deploy basic tools in QGIS to tell stories across multiple layers. The goal in this session is to learn approaches to make your maps compelling visual arguments. The final products should make sense at first glance, and convey your desired narrative or analysis. Topics covered: Quantitative symbology & classification, Subsetting data layers, Querying by attribute, Layout & exporting maps.
|
| Tutorial 5: Tools for Thought |
Mapping for the Urban Humanities: A Summer Institute |
QGIS 3.4 |
GIS, Mapping |
This tutorial briefly introduces several basic methods of geospatial analysis, including how to: Dissolve geographies and data into larger spatial units, calculate areas of geographies, calculate the sums, means and other summary statistics on the data aggregated into larger geographies, join information based on location ("spatial joins"), perform summary statistics inside a spatial join, build a buffer around a feature, select features by location - in this case proximity to a line.
|